

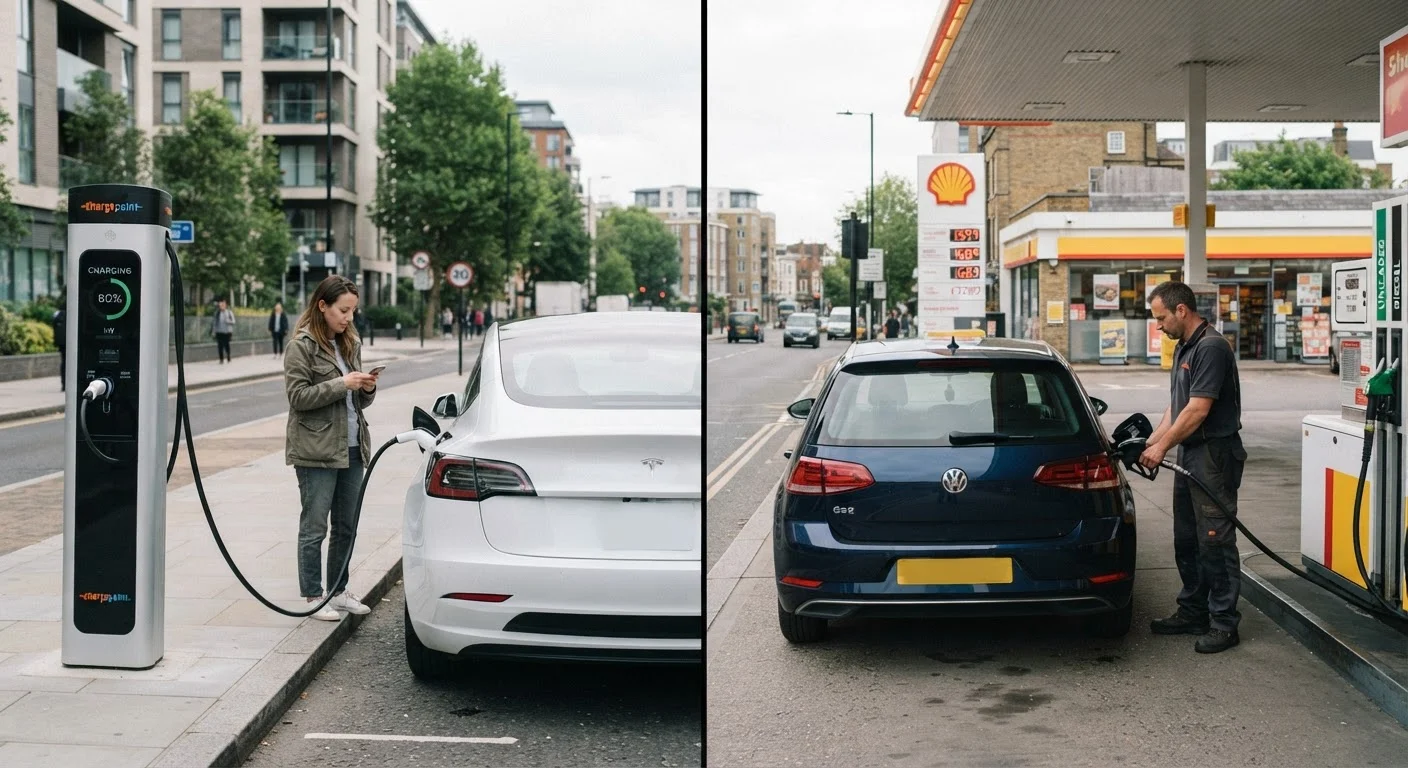
Key Takeaways
- EVs typically cost more to purchase but less to fuel and maintain on an ongoing basis.
- Home charging significantly lowers EV running costs compared to public rapid charging.
- Petrol cars carry lower sticker prices but accumulate higher fuel and servicing costs over years.
- Insurance costs for EVs remain generally higher than equivalent petrol models, though the gap is narrowing.
- The financial crossover point - where EV savings offset the purchase premium - depends heavily on mileage and charging habits.
- Total cost of ownership, not purchase price alone, is the most useful number to compare.
Option A
Electric Vehicles (EVs)
Higher upfront cost, lower day-to-day running expenses.
Best for: Drivers who cover high annual mileage, have home charging access, and want to reduce fuel and routine maintenance spending over time.
Option B
Petrol Cars
Lower purchase price, familiar costs, wider refuelling infrastructure.
Best for: Drivers with lower annual mileage, limited charging access, or those who prioritise lower initial outlay and predictable servicing routines.
If you drive high annual mileage and can charge at home
Electric Vehicles (EVs)
Electricity costs per mile are substantially lower than petrol at most US rates, and reduced servicing frequency compounds savings significantly over 5-10 years.
If your annual mileage is low and you lack home charging
Petrol Cars
Public rapid charging erodes EV fuel-cost advantages, and lower mileage means fewer opportunities to recoup the higher purchase premium through savings.
If upfront cost is your primary constraint
Petrol Cars
Petrol vehicles generally carry a lower sticker price, making them more accessible when initial outlay is the limiting factor - though the long-run cost picture may differ.
If you want to minimise routine maintenance visits
Electric Vehicles (EVs)
EVs have fewer moving parts than petrol engines - no oil changes, fewer brake replacements due to regenerative braking - which reduces service frequency and associated costs.
Fuel and Charging: The Day-to-Day Cost Gap
For most drivers, fuel or electricity is the biggest ongoing running expense after a car payment. On a per-mile basis, electricity is generally cheaper than petrol across the US, but the margin varies considerably depending on your local utility rates, whether you charge at home or use public networks, and petrol prices in your region.
Home charging - typically overnight on a Level 2 charger - delivers the lowest cost per mile for EV drivers. Public DC fast charging can be two to three times more expensive per kilowatt-hour than home rates, which narrows the advantage over petrol significantly. Petrol car costs fluctuate with crude oil markets, but a driver averaging 15,000 miles per year in a mid-size petrol sedan can expect to spend noticeably more on fuel annually than an EV driver charging primarily at home.
For a fuller picture of how these annual expenses compare across vehicle types, see the annual vehicle running costs reference guide for typical figures broken down by category.
| Criterion | Electric Vehicles | Petrol Cars |
|---|---|---|
| Typical purchase price premium | Higher upfront cost | Lower upfront cost |
| Fuel/energy cost per mile | Lower (especially home charging) | Higher (varies with petrol prices) |
| Routine servicing frequency | Less frequent, simpler | More frequent (oil, belts, fluids) |
| Brake wear | Slower (regenerative braking) | Standard wear rate |
| Insurance premiums | Generally higher | Generally lower |
| Refuelling/charging infrastructure | Growing, gaps in rural areas | Widely available nationwide |
| Battery/powertrain longevity concern | Battery degradation over time | Engine wear, transmission costs |
| Depreciation predictability | Less predictable currently | More established patterns |
Maintenance and Servicing: Where EVs Pull Ahead
Petrol engines contain hundreds of moving parts - pistons, belts, a transmission with multiple fluid reservoirs, an exhaust system - all of which require periodic attention. Oil changes alone add up: at roughly 5,000-7,500 mile intervals, a driver can expect six or more oil changes over 50,000 miles. Timing belt replacements, coolant flushes, and spark plug changes are additional scheduled costs that don't apply to EVs.
Electric drivetrains are mechanically simpler. There's no engine oil, no timing belt, no multi-speed gearbox in most models. Brake wear is also slower because regenerative braking - where the motor slows the vehicle and recovers energy - handles much of the deceleration work. The primary EV-specific maintenance concern is the battery pack. Most manufacturers warrant batteries for 8 years or 100,000 miles, but battery degradation (gradual capacity loss over time) is a real factor that affects range and, eventually, resale value.
~40%
Potential reduction in maintenance costs for EVs
The US Department of Energy has estimated that battery electric vehicles can cost roughly 40% less to maintain than comparable internal combustion engine vehicles over their lifetimes.
3-7 years
Typical EV cost crossover timeline
Industry analyses generally estimate that high-mileage drivers with home charging reach the point where total EV costs fall below petrol car costs within 3 to 7 years of ownership.
8 yrs / 100k mi
Standard EV battery warranty in the US
Federal regulations require EV manufacturers to warrant battery packs for at least 8 years or 100,000 miles, providing a baseline of cost protection for buyers.
Understanding the full financial picture of car ownership goes beyond servicing. Our total cost of car ownership breakdown covers how purchase price, depreciation, insurance, and ongoing costs interact.
Insurance, Depreciation, and the Lifetime Calculation
Insurance premiums for EVs tend to run higher than comparable petrol models. Repair costs for EV-specific components - particularly battery packs and specialized sensors - are elevated, and not all repair shops are equipped to handle them, which pushes premiums up. That said, the gap between EV and petrol insurance costs has been narrowing as repair infrastructure expands and insurers gather more claims data.
Depreciation is more complex. Some EV models have depreciated faster than petrol equivalents in recent years, partly driven by rapid technology changes and falling new-car prices in the segment. Petrol cars have more predictable depreciation curves, though this varies by make and model class. Neither category offers a guarantee on resale value.
When you add purchase price premium, fuel savings, servicing differences, and insurance together, the "crossover point" - where lifetime EV costs fall below petrol costs - typically occurs somewhere between 3 and 7 years for high-mileage drivers with home charging, based on general industry analysis. Lower mileage or reliance on public charging extends that timeline considerably.
If you're also weighing how you finance the vehicle, our comparison of leasing vs. buying costs over time is worth reading alongside this one - the financing structure affects how these savings actually land in your budget.
Federal Tax Credits May Affect Your Upfront Calculation
Depending on your income, tax liability, and the specific vehicle you purchase, federal and state incentives may reduce the effective purchase price of a new EV. Eligibility rules change over time and vary by vehicle and buyer. Consult a qualified tax professional or check official IRS guidance to understand what may apply to your situation - incentive amounts should not be assumed when budgeting.