

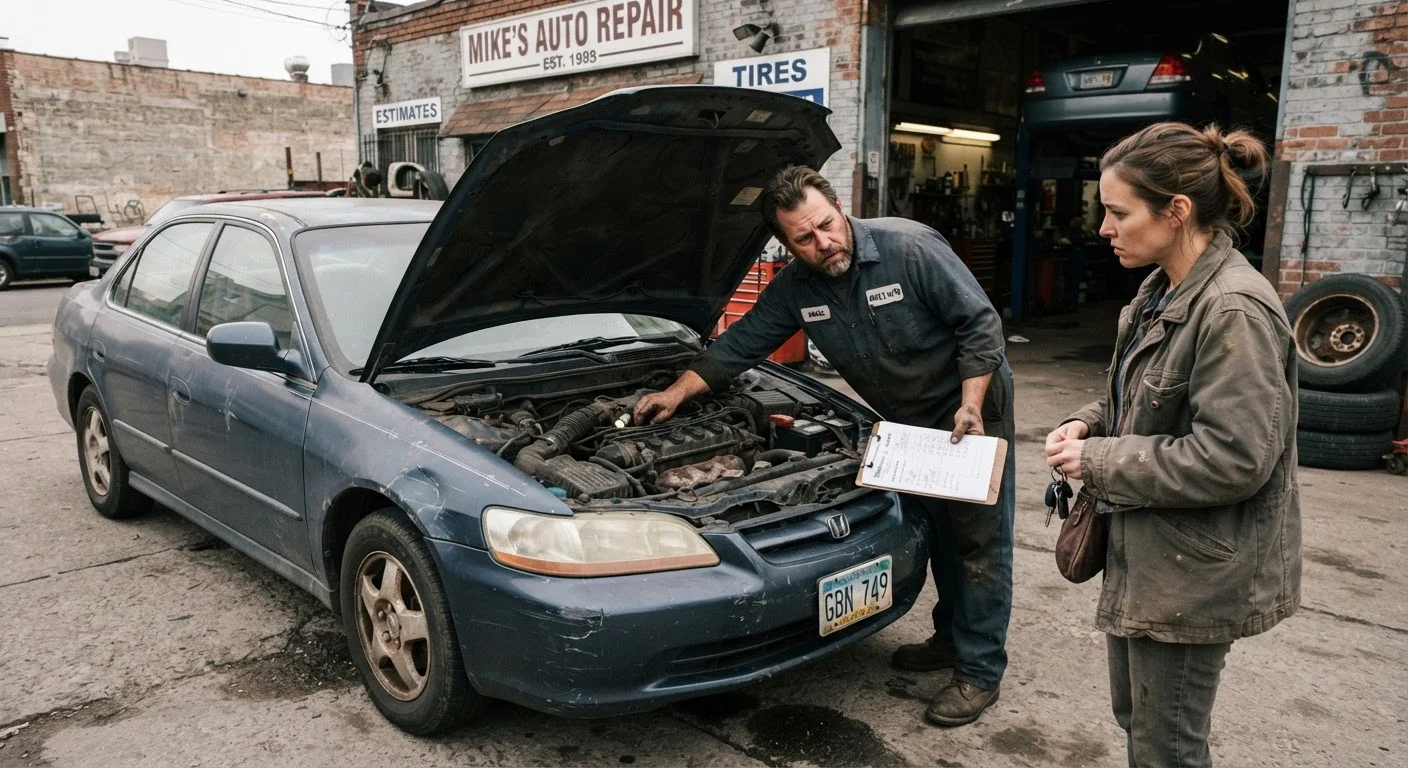
Key Takeaways
- Repair costs on older vehicles often spike unpredictably as multiple systems age simultaneously.
- Fuel inefficiency in older engines can quietly add hundreds of dollars to annual running costs.
- A car worth less than its annual repair bill is generally past the financial tipping point.
- Reliability loss - missed work, rental fees, towing - is a real but often uncounted cost.
- Tracking every expense over 12 months gives you the clearest picture of your car's true cost.
The Financial Tipping Point
The financial tipping point is the moment when the total cost of keeping an older car - repairs, fuel, insurance, and unreliability - exceeds what it would cost to own a newer, more dependable vehicle. It's not a single number but a pattern of escalating expenses that signals your car has shifted from an asset to a drain. Recognising this point helps you decide whether to repair, keep, or replace.
Analysts sometimes frame this as the crossover point where marginal repair costs consistently exceed the vehicle's market value or the monthly equivalent cost of a replacement - whichever comes first.
Why Older Cars Aren't Always the Budget Option
Many drivers hold onto older vehicles with a straightforward logic: no car payment means lower monthly costs. That reasoning holds up early in a car's life, but it gradually weakens as the vehicle ages. The real question isn't whether you have a loan - it's what the car actually costs you each month when you add everything up.
True car ownership costs extend well beyond loan payments. Fuel, insurance, registration, and maintenance all figure in. For older vehicles, maintenance is where the math can shift dramatically. Components have finite lifespans, and when one system starts to fail, others often follow - especially in cars past the 100,000-mile or 10-year mark.
$1,986
Average annual vehicle maintenance cost (AAA estimate)
AAA's Your Driving Costs study has consistently found that maintenance and repair costs rise notably as vehicles age and accumulate mileage.
225+ gallons
Extra fuel per year at 20 vs. 32 mpg (15,000 miles)
Based on straightforward mpg arithmetic, the fuel cost gap between an older and newer vehicle can represent several hundred dollars annually depending on local gas prices.
$2,500-$4,500
Typical transmission replacement cost range
Industry repair-cost databases consistently place automatic transmission replacement in this range, making it one of the costlier single-repair events for an aging vehicle.
How Repair Costs Escalate Over Time
A vehicle's repair trajectory rarely rises in a straight line. Years one through five tend to be calm. Years six through ten may bring moderate costs - brake jobs, battery replacements, routine wear items. Beyond that, and especially past 150,000 miles, the pattern often shifts to larger, less predictable expenses: timing chains, transmissions, suspension components, and aging electronics.
The challenge is that these repairs don't arrive with advance notice. A transmission replacement can run $2,500-$4,500. A major engine repair can easily exceed the vehicle's private-party resale value. When a single repair bill exceeds 50% of what you could sell the car for, that's a meaningful signal worth evaluating carefully.
Keeping maintenance costs manageable through consistent upkeep can delay this curve, but it cannot eliminate it entirely.
The Hidden Costs: Fuel and Reliability
Two costs that rarely get enough attention are fuel efficiency and the financial impact of unreliability. Older engines - particularly those predating modern direct injection and variable valve timing - often deliver meaningfully lower fuel economy than current equivalents. For a driver covering 15,000 miles per year, the difference between 20 and 32 mpg translates to roughly 225 additional gallons of gas annually. At average U.S. pump prices, that's a real, recurring expense.
Reliability loss carries its own price tag. A breakdown that strands you at work or on a highway can mean towing fees ($75-$200 on average), a rental car ($50-$100 per day), and potentially lost wages. These costs are easy to undercount because they feel like one-off emergencies - but if they happen two or three times a year, they add up quickly.
Track Every Car Expense for 12 Months
Use a simple spreadsheet or a free expense-tracking app to log every car-related cost - fuel, repairs, insurance, registration, and breakdowns. After 12 months, you'll have an accurate total that makes the keep-or-replace decision much clearer. Most drivers are surprised how quickly smaller costs accumulate alongside major repairs.
See our annual vehicle running costs reference guide to benchmark what you should expect to spend each year.
Reading the Signals: When to Act
No single event marks the tipping point for every driver. It's better understood as a pattern. Consider acting when:
- Annual repair costs have exceeded the vehicle's current market value over any rolling 12-month window.
- Breakdowns have become frequent enough to affect work, family commitments, or safety.
- A mechanic identifies multiple major repairs needed - not urgently, but soon.
- You're putting off repairs because the cost feels disproportionate to the car's value.
Depreciation is less of a concern with older vehicles since most of that value loss has already happened - but a car approaching $0 in market value offers no financial cushion when a major repair arrives.
If you're weighing a transition, it's worth considering your broader transportation budget and whether alternatives - including electric vehicles versus petrol cars - might change your long-term cost picture. There's no universal right answer, but having accurate numbers makes the decision far easier.